
Sefton's claimant count rose 225 in August to 6,410, its biggest monthly jump since July 2024. Kew and Norwood led the rise across Southport's seven wards.
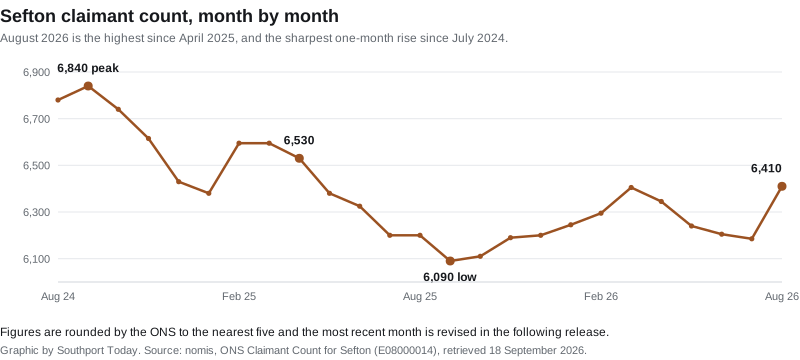
The number of people claiming unemployment-related benefits in Sefton rose by 225 in August 2026, to 6,410. That is 3.8 per cent of residents aged 16 to 64, and it is the sharpest one-month rise in the borough since July 2024 (nomis, ONS Claimant Count).
It is also the highest monthly figure since April 2025, when the count stood at 6,530.
Two things make this month different from the last one. The rise is bigger here than in the region or the country. And it is spread almost everywhere: nineteen of the borough’s twenty-two wards went up, two were flat, and only one fell.
Sefton rose faster than the North West and Britain
In July we reported that Sefton’s increase was milder than the national picture. In August that reversed.
| Area | July 2026 | August 2026 | Change |
|---|---|---|---|
| Sefton | 6,185 | 6,410 | +3.6% |
| North West | 196,615 | 201,555 | +2.5% |
| Great Britain | 1,627,155 | 1,664,295 | +2.3% |
The same holds over twelve months. Sefton is up 210 on August 2025, a rise of 3.4 per cent, against 2.9 per cent across the North West and 2.3 per cent across Great Britain.
Sefton’s rate is still the lower one. At 3.8 per cent the borough sits below the North West’s 4.2 per cent and below Britain’s 3.9 per cent. What changed in August is the direction of travel, not the ranking.
The over-50s are carrying the year’s increase
The age breakdown separates a one-month wobble from a longer trend, and here they point at different groups.
| Age band | Aug 2025 | Jul 2026 | Aug 2026 | On the month | On the year |
|---|---|---|---|---|---|
| 16 to 24 | 1,300 | 1,300 | 1,380 | +80 | +80 |
| 25 to 49 | 3,575 | 3,455 | 3,570 | +115 | -5 |
| 50 and over | 1,325 | 1,430 | 1,455 | +25 | +130 |
Over a year, the 25 to 49 group, which is by far the largest, is essentially unchanged. The whole of Sefton’s annual increase sits in the two bands either side of it, and the bigger of the two is the over-50s, up 130 or 9.8 per cent. At 1,455 that band is at its highest since April 2025.
The month-on-month picture is different again. August’s jump is led by the 25 to 49 group, up 115, with under-25s up 80. A single month is not a trend, and August is a month when school and college leavers enter the count, so treat the under-25 figure with that in mind.
Seen over two years, the shape is a hump. The count peaked at 6,840 in September 2024, fell away for a year to a low of 6,090 in September 2025, and has drifted upwards ever since. August’s 6,410 is the highest point of that climb.
The July figure we published has been revised down
One caution about last month’s story. When we reported the July figure on 21 August we gave it as 6,295, which is what the ONS had published. The ONS has since revised July down to 6,185, a cut of 110.
The revision runs through the ward figures too, so it is a genuine restatement rather than a rounding artefact. It also means August’s rise looks larger than it would have done against the original July number. Against the figure we originally published, the increase would have been 115 rather than 225.
The claimant count is routinely revised a month in arrears. It is worth knowing before comparing any two months from different releases.
The seven Southport wards
The borough average hides a lot. Southport’s seven wards held 1,820 claimants in August, up 60 on July.
| Ward | July | August | Change | Under 25s | Under-25 share |
|---|---|---|---|---|---|
| Duke’s | 385 | 395 | +10 | 40 | 10.1% |
| Kew | 300 | 320 | +20 | 85 | 26.6% |
| Norwood | 285 | 305 | +20 | 70 | 23.0% |
| Cambridge | 265 | 255 | -10 | 35 | 13.7% |
| Birkdale | 210 | 210 | 0 | 45 | 21.4% |
| Ainsdale | 180 | 195 | +15 | 45 | 23.1% |
| Meols | 135 | 140 | +5 | 25 | 17.9% |
Cambridge was the only ward in the whole borough to fall. Birkdale held completely flat, as did Ford in the south of the borough.
Kew is again the outlier on age. More than a quarter of its claimants are under 25, the highest share of any Southport ward, and it was also the highest last month. Duke’s is the mirror image: the largest total in Southport, but only one claimant in ten is under 25, and it has the town’s largest over-50 group at 120.
Elsewhere in the borough, Linacre in Bootle remains the highest ward anywhere in Sefton at 780. The steepest proportional rise was in Harington, the Formby ward, which went from 80 to 95, an increase of almost a fifth from a small base.
The twenty-two ward totals add to 6,405 against a borough figure of 6,410. Last month they matched exactly. The five-claimant gap is rounding, not an error.
What it means for you
If you are claiming, or about to, the practical points are unchanged. The count covers people on Universal Credit who are required to look for work as well as those on Jobseeker’s Allowance, so it is a wider measure than the old dole queue and is not the same thing as the unemployment rate.
If you are looking for work in Southport, the age pattern is the useful part. Competition among under-25s is heaviest in Kew and Norwood, and August is the month when that group swells. For anyone over 50, the borough has added 130 claimants in that band in a year while the middle of the workforce has not moved at all, which is the clearest signal in this release.
One release does not make a trend, and a single month that jumps is often partly seasonal. What would make August meaningful is September repeating it. We will check when the next figures land in mid-October.
Our other local data pages cover house prices across the borough and Sefton’s planning decisions.
Sources
- nomis, ONS Claimant Count (dataset NM_162_1), August 2026, borough, region, Great Britain, age bands and the 22 Sefton wards, retrieved 18 September 2026
- Our earlier report: Sefton claimant count, July 2026
Have your say