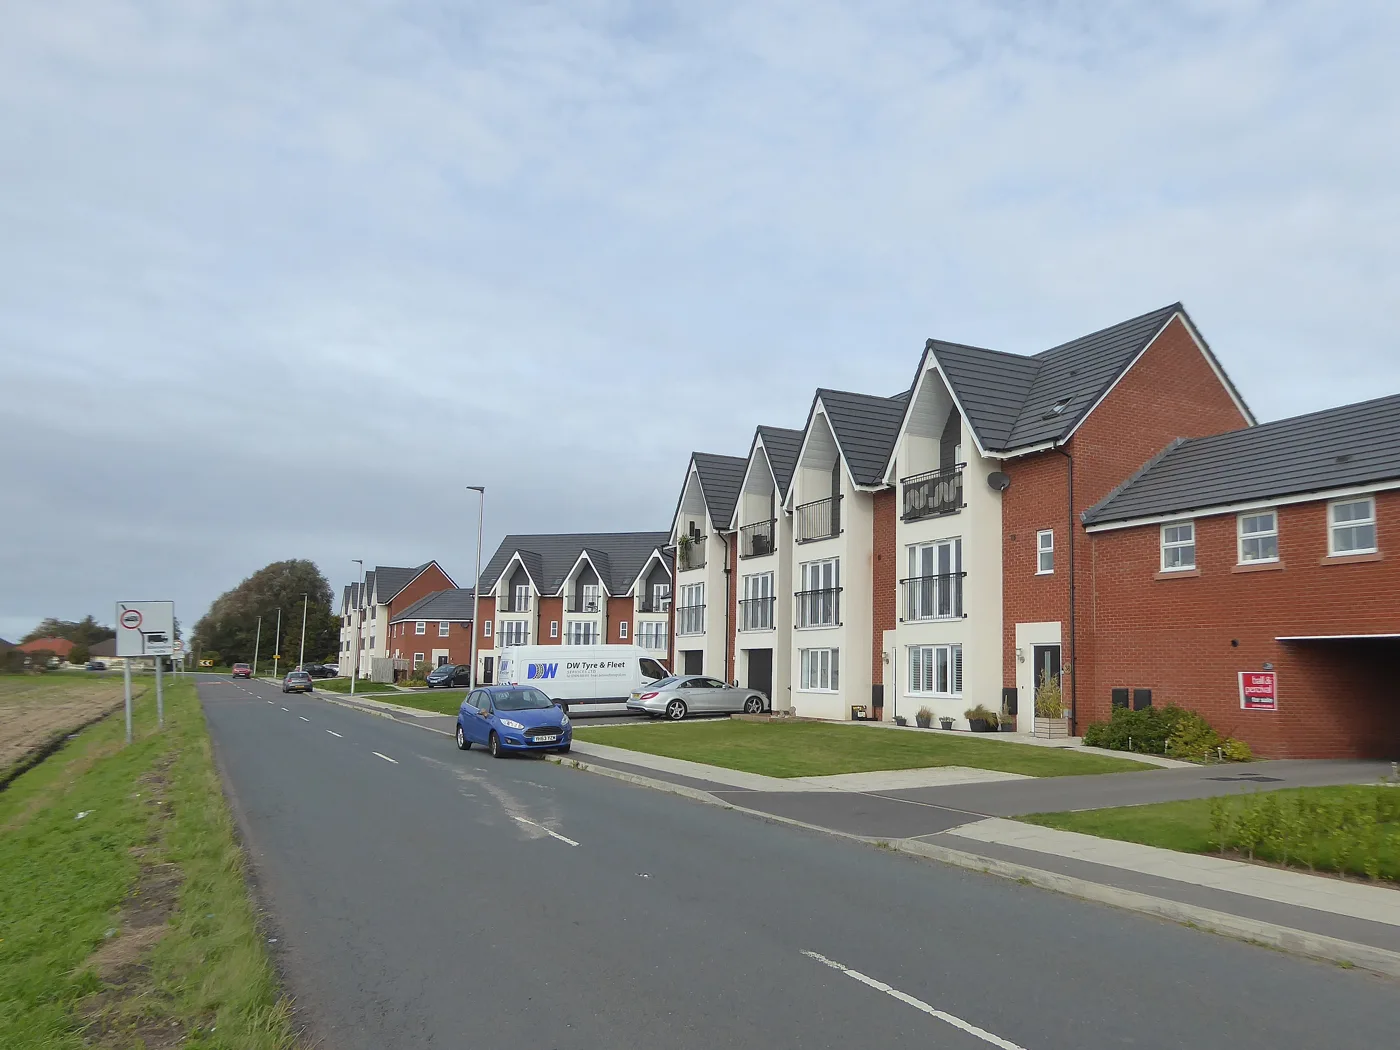
The average Sefton home reached £225,433 in June, the highest figure since the index began in 1995. Terraced homes rose fastest at 6.7%; flats barely moved.
The average home in Sefton cost £225,433 in June 2026, £11,208 more than a year earlier. That is a rise of 5.2%, and it is the highest monthly figure the borough has recorded since the index began in January 1995.
The figures come from the UK House Price Index, published by HM Land Registry in August. It is built from completed sales, so it runs a couple of months behind the market, but it records what buyers actually paid rather than what sellers asked.
The dearest borough in Merseyside, but not the fastest
Sefton has the highest average price of Merseyside’s five boroughs. It has the second slowest rate of growth.
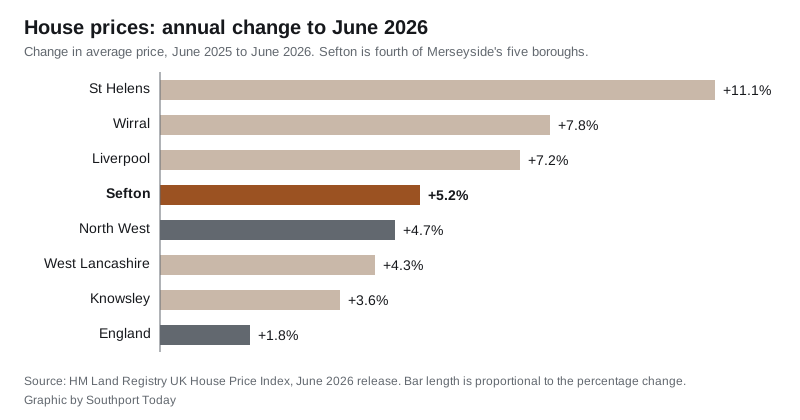
Ranked by annual change, with the June average in brackets:
- St Helens: +11.1% (£186,435)
- Wirral: +7.8% (£215,575)
- Liverpool: +7.2% (£185,307)
- Sefton: +5.2% (£225,433)
- West Lancashire: +4.3% (£231,816)
- Knowsley: +3.6% (£189,116)
Merseyside as a whole rose 6.8% to £201,008. The North West rose 4.7% to £219,922. England rose 1.8% to £293,262, which means Sefton added nearly three times the national rate. Each figure is on the same index, by area.
West Lancashire, across the border at Scarisbrick and Ormskirk, is still slightly dearer than Sefton at £231,816, but the gap closed by about £2,000 over the year.
63rd of 295
Set against every local authority district in England, Sefton had the 63rd highest annual rise of 295. A month earlier it was 97th, at 3.3%. In the June 2025 release it was 11th, at 7.0%, so the borough has slowed from the front of the pack and then picked up again. In the latest figures 233 English districts rose and 62 fell.
The fastest rise in the North West was Preston, at 12.4%, second in England.
Terraced homes did the work
Every property type rose, but not evenly:
| Type | June 2026 average | Annual change |
|---|---|---|
| Detached | £400,086 | +4.8% |
| Semi-detached | £250,139 | +5.9% |
| Terraced | £184,254 | +6.7% |
| Flat or maisonette | £127,660 | +2.1% |
Terraced houses, the cheapest houses in the borough, rose fastest. Flats, the cheapest homes of all, barely moved. A terraced home in Sefton now costs £11,573 more than it did in June 2025. A flat costs £2,626 more.
Detached homes crossed £400,000 for the first time in the index. That is the figure to bear in mind when reading the borough average: Sefton runs from Crossens down to Bootle, and a single mean blends Formby and Birkdale with Litherland and Netherton. The per-postcode medians are on our Southport house prices page.
First-time buyers paid £192,680
The index splits buyers as well as homes. A first-time buyer in Sefton paid an average of £192,680 in June, up 5.6% on the year. Someone who already owned a home paid £267,600, up 4.9%.
Cash buyers paid £203,318 on average, up 4.6%. Buyers with a mortgage paid £237,041, up 5.5%.
Fewer sales, and why the March figure looks strange
The index publishes sales counts about three months behind prices. The latest published month is April 2026, with 186 sales in Sefton, against 193 in April 2025.
March 2026 had 263 sales. March 2025 had 562, nearly twice as many. That was the rush to complete before the stamp duty thresholds changed on 1 April 2025, and it makes any March comparison meaningless. Over a normal month the borough now records somewhere between about 190 and 375 sales.
One caution on the number
UKHPI is a mean average, not a median. It is pulled up by the most expensive sales, so the “average home” is dearer than the middle home. The Land Registry’s own price paid data records every individual sale, and it is those records our postcode-by-postcode figures are built from. The June figures will also be revised in later releases as late-registered sales arrive; the June 2025 figure has already been revised since it was first published.
What it means for you
- Selling: the borough is at a record high and rising faster than England, so pricing on last year’s sold prices will undersell a terraced or semi-detached house in particular.
- Buying a first home: the £192,680 first-time buyer average is a borough-wide figure. Terraced homes at £184,254 sit below it, and flats at £127,660 well below, and flats are the only type not keeping pace with the market.
- Moving within Sefton: the gap between a flat and a terraced house widened by about £9,000 in a year. The gap between a semi and a detached house widened by about £5,000.
- Council tax: a higher sale price does not change your band. Bands are still set on 1991 values, and the 2026/27 charges are on our Southport council tax bands page.
- Planning: if the house you are watching has an application on it, our Southport planning news page explains how to read and comment on it.
The next release, covering July 2026, is due from HM Land Registry in mid-September.
Have your say
We read every message. To comment on this story, email the newsdesk and we may publish a selection of responses: hello@southporttoday.co.uk.