
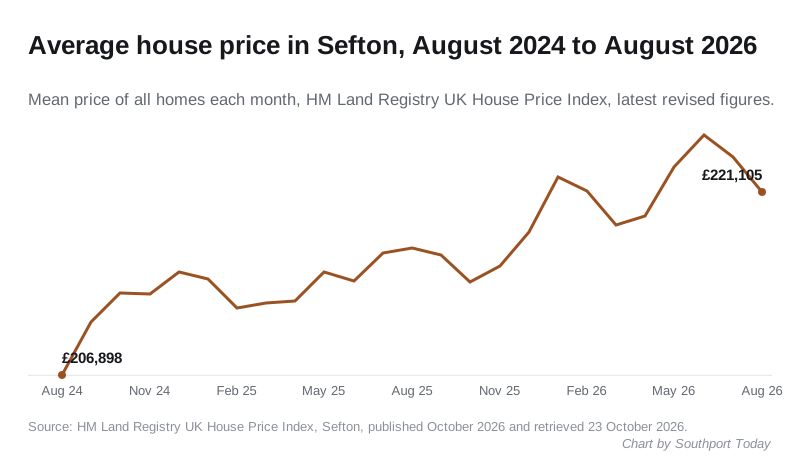
The average Sefton home cost £221,105 in August, down 1.2% on July and the second monthly fall. Annual growth has slowed to 2.0%, behind Wirral and Liverpool.
The average home in Sefton cost £221,105 in August 2026, down 1.2 per cent on July. It is the second monthly fall in a row (HM Land Registry, UK House Price Index).
Prices are still higher than a year ago, by £4,320. But the annual rise has slowed to 2.0 per cent, the weakest since December 2025.
Two months ago the picture looked different. In June the borough’s average reached £225,505. August’s figure is £4,400 below that.
Every type of home fell in August
| Property type | Average price, August 2026 | Change on July | Change in a year |
|---|---|---|---|
| Detached | £386,996 | -1.9% | +1.0% |
| Semi-detached | £246,240 | -1.1% | +3.1% |
| Terraced | £181,535 | -1.0% | +3.1% |
| Flat | £125,367 | -1.1% | -1.2% |
| All homes | £221,105 | -1.2% | +2.0% |
Detached homes dropped furthest on the month, by £7,658, and their annual rise is now just 1.0 per cent. Flats are cheaper than they were a year ago.
First-time buyers paid £189,330 on average, up 2.4 per cent on August 2025.
Sefton is now rising more slowly than its neighbours
Over twelve months, most of the area around Sefton has seen prices rise much faster.
| Area | Average price, August 2026 | Change in a year |
|---|---|---|
| West Lancashire | £240,850 | +5.6% |
| Wirral | £221,673 | +5.8% |
| Sefton | £221,105 | +2.0% |
| North West | £220,393 | +2.2% |
| Knowsley | £191,550 | +1.6% |
| Liverpool | £188,427 | +4.7% |
| England | £293,525 | +0.4% |
West Lancashire, which takes in Ormskirk, Burscough and Banks on Southport’s eastern edge, rose 1.9 per cent in August alone. Sefton fell 1.2 per cent in the same month.
Wirral’s average has now edged above Sefton’s, by £568. In July, Sefton’s was the higher of the two, by £2,864. A gap that size can swing either way from one month to the next, so read it as the two boroughs being level rather than one overtaking the other.
England as a whole is barely moving, up 0.4 per cent. Sefton is still rising faster than the country. It is just no longer rising faster than the North West.
July’s figure has been revised down
When we reported July’s figures last month, the index gave Sefton’s average as £224,289. The Land Registry has since revised July to £223,860, a cut of £429.
That is normal. The index is built from completed sales registered with the Land Registry, and late registrations arrive for months afterwards. The most recent months are always the least settled, and August’s figure may move too.
UKHPI is a mean average, not a median. A handful of expensive sales can lift it, and a month with fewer of them can pull it down. That is one more reason not to read too much into a single month.
What it means for you
If you are buying in Southport, Formby or anywhere else in the borough, two months of falls take some heat out of the market. They do not mean prices are dropping in any sustained way. The average is still higher than in any month of 2025.
If you are selling, the comparison with a year ago still works in your favour, but by less than it did. A Sefton home bought at the average price in August 2025 would now be worth about £4,320 more on paper, before costs.
For a house hunter weighing Southport against Ormskirk or the Wirral, the gap has moved. Over the past year, prices on the other side of the boundary have risen almost three times as fast as Sefton’s.
The September figures are due in November. Our Southport house prices page has the longer-term picture by area and property type.
Sources
- HM Land Registry, UK House Price Index, Sefton, Wirral, West Lancashire, Liverpool, Knowsley, North West and England, August 2026 and earlier months as revised, retrieved 23 October 2026
- Our earlier report: Sefton house prices, July 2026
Have your say